

Updated with July 31 closing prices.
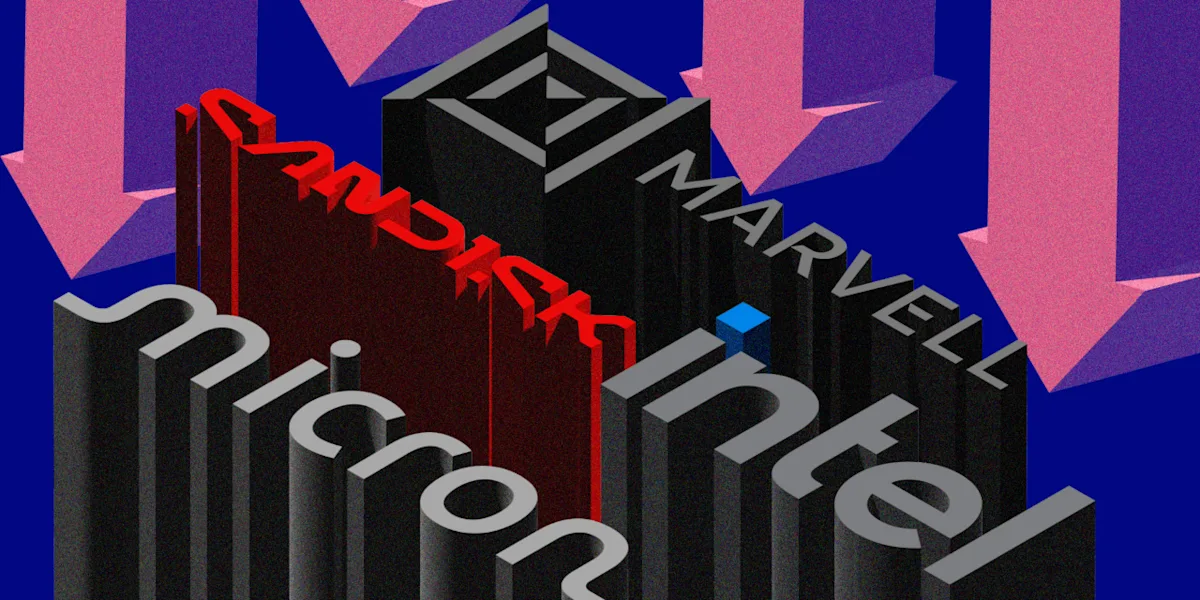
After a whipsaw end to the month, with a blowout earnings report from Microsoft followed by a bummer of a report from Apple, a painful decline for semiconductor stocks highlighted a tough July for the stock market.
Most Read from MarketWatch
Even with a 9% surge in the last two days of the month, the iShares Semiconductor ETF SOXX, which holds stocks of 30 chip makers and associated companies, was down 22.1% for July. That made for the worst month for SOXX since it tumbled 23.3% in December 2002, according to FactSet data. But the ETF was still up 67.7% for 2026.
Also read: Implosion of Situational Awareness hedge fund has Wall Street betting the bottom is in for the AI trade.
Meanwhile, the iShares Expanded Tech-Software Sector ETF IGV was up 4.4% for July, mainly on the strength of Microsoft’s stock MSFT, which ran up 24.6% for the month, but was still down 3.9% for 2026. And the broader technology sector as tracked by the State Street Select Sector SPDR ETF XLK dropped 8% in July, made worse by the 7.4% selloff in Apple’s stock AAPL on Friday.
Read: Supply-chain legend Tim Cook finally meets his match with Apple’s memory crunch
Memory-chip maker Micron Technology’s stock MU punctuated the seesaw end to the month. It soared 18.4% on Thursday but was down 5.9% on Friday and down 28.7% for the month.
With all the noise, the S&P 500 index SPX ended with a slight decline for the month, marking the first time it had a down July since 2014. The index had declined 1.1% in June.
The S&P 500’s biggest losers and winners for July
Because of the dramatic decline for semiconductor stocks during most of July, we will first list the S&P 500’s largest decliners for the month. Then, we’ll list the biggest winners for the month among components of the index.
Here are the largest 20 decliners among the S&P 500 during July:
|
Company |
July price change |
2026 price change |
2025 price change |
|
Sandisk SNDK |
-46.6% |
411.8% |
N/A |
|
Corning GLW |
-45.9% |
57.9% |
84.3% |
|
KLA KLAC |
-39.4% |
50.5% |
92.8% |
|
Marvell Technology MRVL |
-37.0% |
120.7% |
-23.1% |
|
Intel INTC |
-35.4% |
144.4% |
84.0% |
|
Coherent COHR |
-33.4% |
42.4% |
94.8% |
|
Generac Holdings GNRC |
-32.7% |
44.5% |
-12.0% |
|
Lam Research LRCX |
-32.4% |
71.2% |
137.0% |
|
Flex FLEX |
-29.8% |
88.3% |
57.4% |
|
Applied Materials AMAT |
-29.8% |
97.5% |
58.0% |
|
Micron Technology MU |
-28.7% |
188.4% |
239.1% |
|
Vertiv Holdings VRT |
-27.9% |
49.1% |
42.6% |
|
Lennox International LII |
-27.4% |
-14.4% |
-20.3% |
|
Tesla TSLA |
-26.0% |
-30.8% |
11.4% |
|
Builders FirstSource BLDR |
-25.7% |
-35.4% |
-28.0% |
|
Teradyne TER |
-24.0% |
90.0% |
53.7% |
|
Caterpillar CAT |
-23.5% |
42.2% |
57.9% |
|
AppLovin APP |
-23.2% |
-41.2% |
108.1% |
|
Ciena CIEN |
-23.1% |
61.2% |
175.8% |
|
Moderna MRNA |
-21.7% |
85.9% |
-29.1% |
|
Source: LSEG |
|||
Leave a Reply